You'll be re-directed to the Institutional Investor site.
Key Takeaways1
- Aggregate single-employer plan funded status rose by more than three percentage points to 105.6% in the first quarter, thanks to strong equity market returns and a modest increase in discount rates.
- We believe that the current macro environment supports maintaining target interest rate and credit spread hedge ratios, but plan sponsors may wish to modestly underweight Long Credit relative to U.S. Treasuries and other spread sectors, where valuations may be more attractive.
- Further refinements in liability interest rate and credit spread sensitivities and attendant adjustments in the liability-hedging strategy can reduce future plan experience risk and year-to-year actuarial gains and losses. This includes applying plan-specific demographic assumptions and closely analyzing interest-rate-sensitive provisions, such as cash balance benefits.
- The pension risk transfer market continues to be robust, with two jumbo deals announced so far in 2024. However, regulatory uncertainty and recent litigation may lead to elevated headline risk, adding to an already-long list of plan sponsors’ considerations.
Quarterly Funded Status Drivers
Figure 1. Funded Status Drivers

Source: Bloomberg Index Services, Milliman, MSCI. The funded status and discount rate are for the Milliman 100 Pension Funding Index.
Global equity markets posted strong returns, and corporate bond yields rose in the first quarter. The aggregate funded status of the 100 largest corporate pension plans rose by over three percentage points and ended the quarter at 105.6%. This is slightly below its most recent high of 106.2% achieved in October 2022. Plans with large allocations to return-seeking assets, particularly U.S. equities, likely saw even larger funded status gains.
Inflation and the labor market were all more resilient than many market participants anticipated at year end, leading the Federal Reserve to signal that it is in no hurry to cut interest rates. The March inflation report, released in early April, was particularly “hot.” As of mid-April, the market has priced in at most two 25 bp Fed cuts in 2024, compared to six 25 bp cuts priced in last December.
Reflecting this “higher-for-longer” sentiment, Treasury yields rose roughly 30 to 40 bp across all maturities over two years, reversing the downward trend from the fourth quarter of 2023. Likewise, despite robust new issuance, including at longer maturities (see Figure 2), credit spreads tightened 8 bp across the maturity spectrum. Long-term credit spreads, as measured by the Bloomberg U.S. Long Credit Index, fell to the second percentile based on 20 years of weekly observations.
Figure 2. Corporate Issuance by Maturity
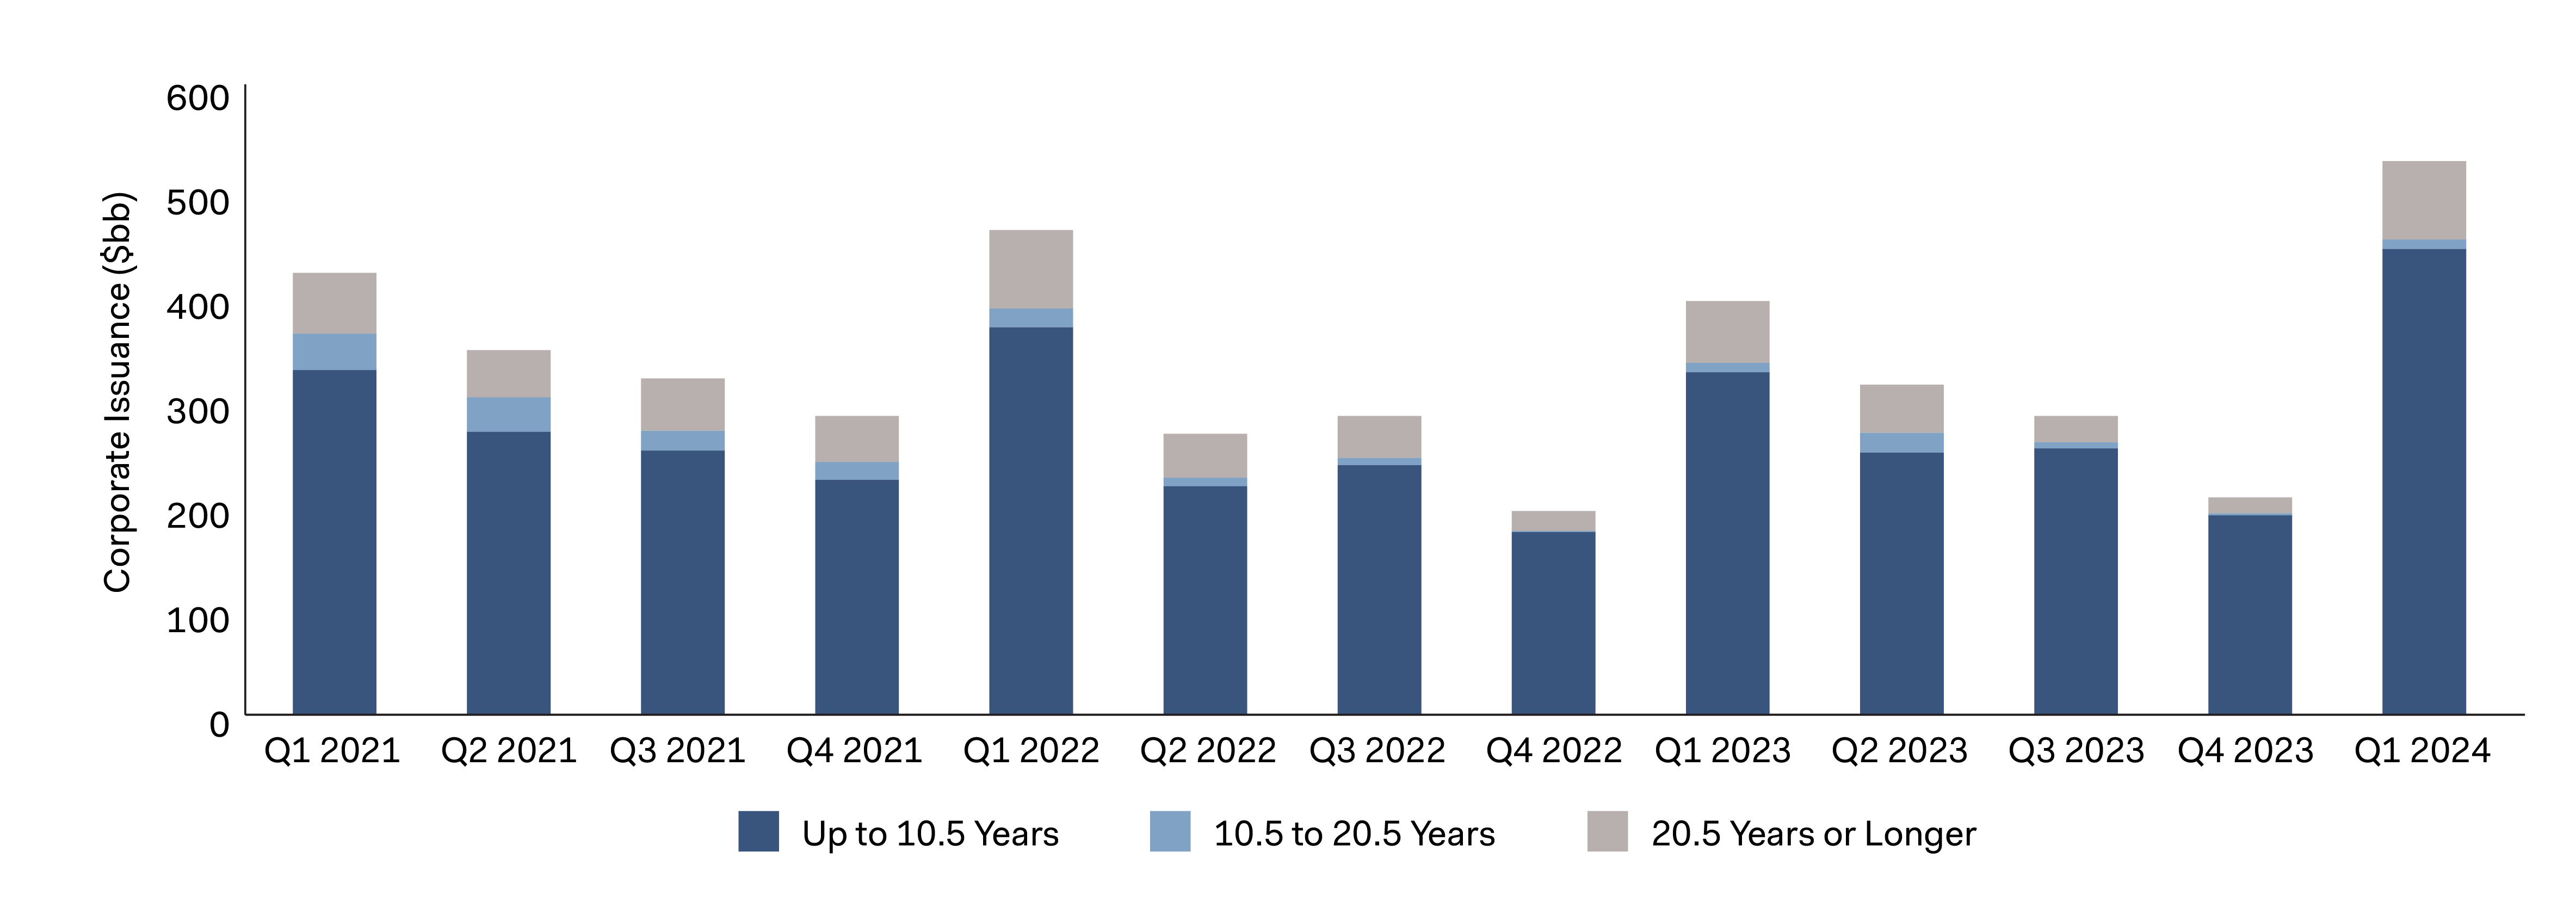
Source: JP Morgan.
Maintaining the Hedge
As in prior quarters, we continue to believe that well-funded plans are best served by closely matching liability interest rate and credit spread risks, while ensuring that portfolio construction acknowledges the specific nature of the discount rate (e.g., “high AA” or broader AA) and, potentially, the correlation between credit spreads and return-seeking assets. We address these issues in our papers, Practical Considerations for Hedging the Liability Discount Rate: Managing the Credit Spread Hedge and Intermediate Credit: Refining the Credit Spread Hedge and Generating Alpha.
Our macro outlook continues to call for a soft landing over the next two years. However, in our base case, we anticipate a slower and smaller decline in interest rates than previously estimated, given the resilient economy and labor market. Although there does not appear to be a fundamental economic catalyst to drive interest rates sharply lower or higher, various geopolitical and election risks could create volatility. Thus, taking on any material risks relative to the liability discount rate may not be worthwhile. Instead, plan sponsors with large (or large-enough) surpluses may wish to express large macro views in surplus assets.
Playing Defense with Credit
As long-term credit spreads hit historic lows over the last few quarters, many plan sponsors have considered modestly underweighting credit spread hedge ratios. This thesis has only partly worked out over the last six months as credit spreads continued to tighten and credit has largely outperformed high-quality securitized assets on a durationadjusted, excess-of-curve basis4 (see Figure 3). Fortunately, much of this underperformance has likely been offset by strong equity returns, protecting funded status.
Figure 3. Excess-of-Curve Return Per Unit of Duration5
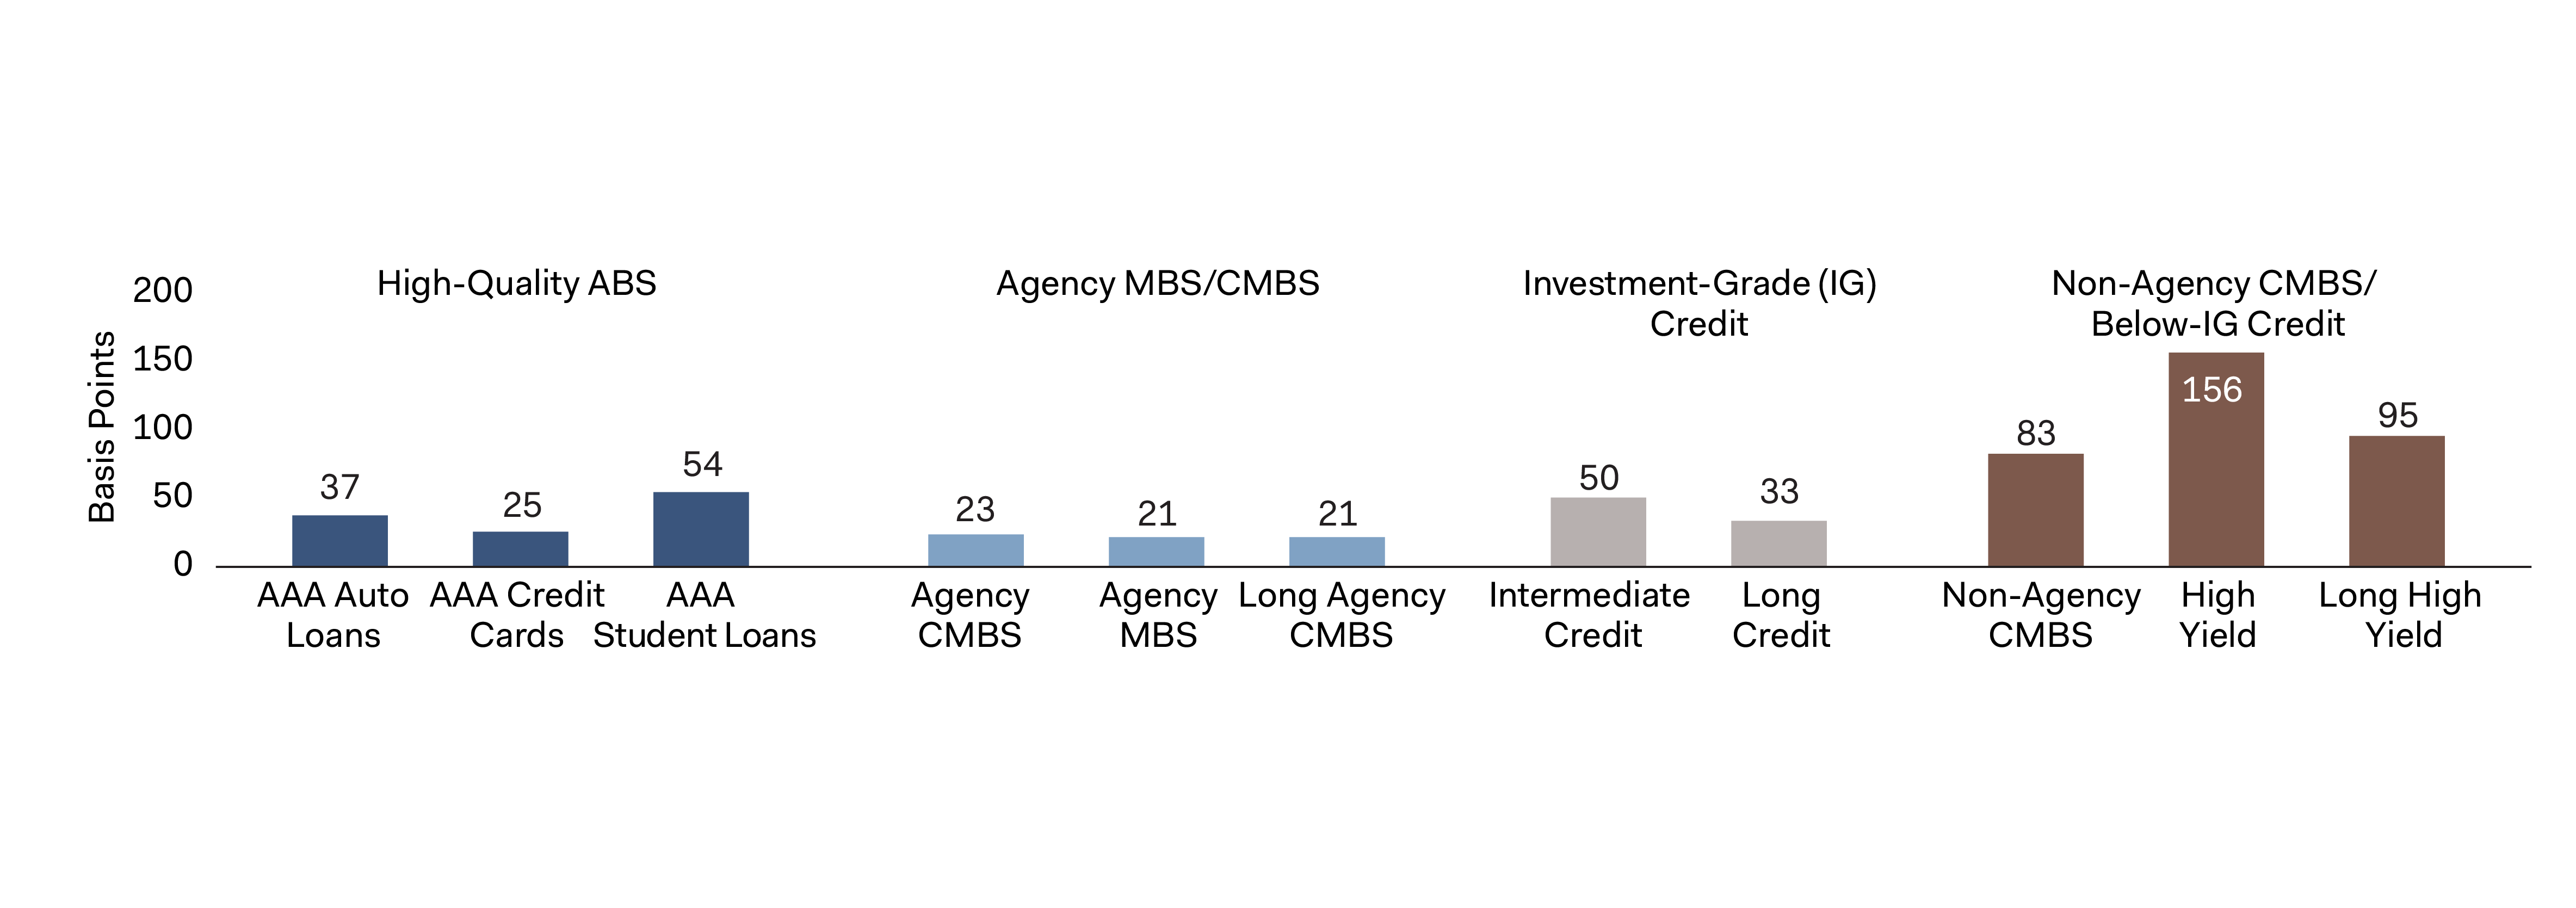
Source: Bloomberg Index Services, Dodge & Cox. For the six-month period ended March 31, 2024.
Still, taking a longer-term view, we believe this underweight is justified. After the most recent quarter of spread tightening, Long Credit appears to be the most overvalued among the traditional spread sectors (see Figure 4). On the other hand, corporate fundamentals, demand for corporate credit, and the macroeconomic backdrop all remain supportive. In addition, over the last 12 months, rating agency upgrades exceeded downgrades in the investment-grade space. Balancing these considerations, we believe it may be sensible to continue to underweight Long Credit, at least slightly, and to reserve some “dry powder” for more attractive entry points. Reflecting this view, last quarter we further lightened credit exposure in our fully discretionary liability hedging strategies, with the largest decrease in our Long Government/Credit strategy.
Figure 4. Option-Adjusted Spread Percentile
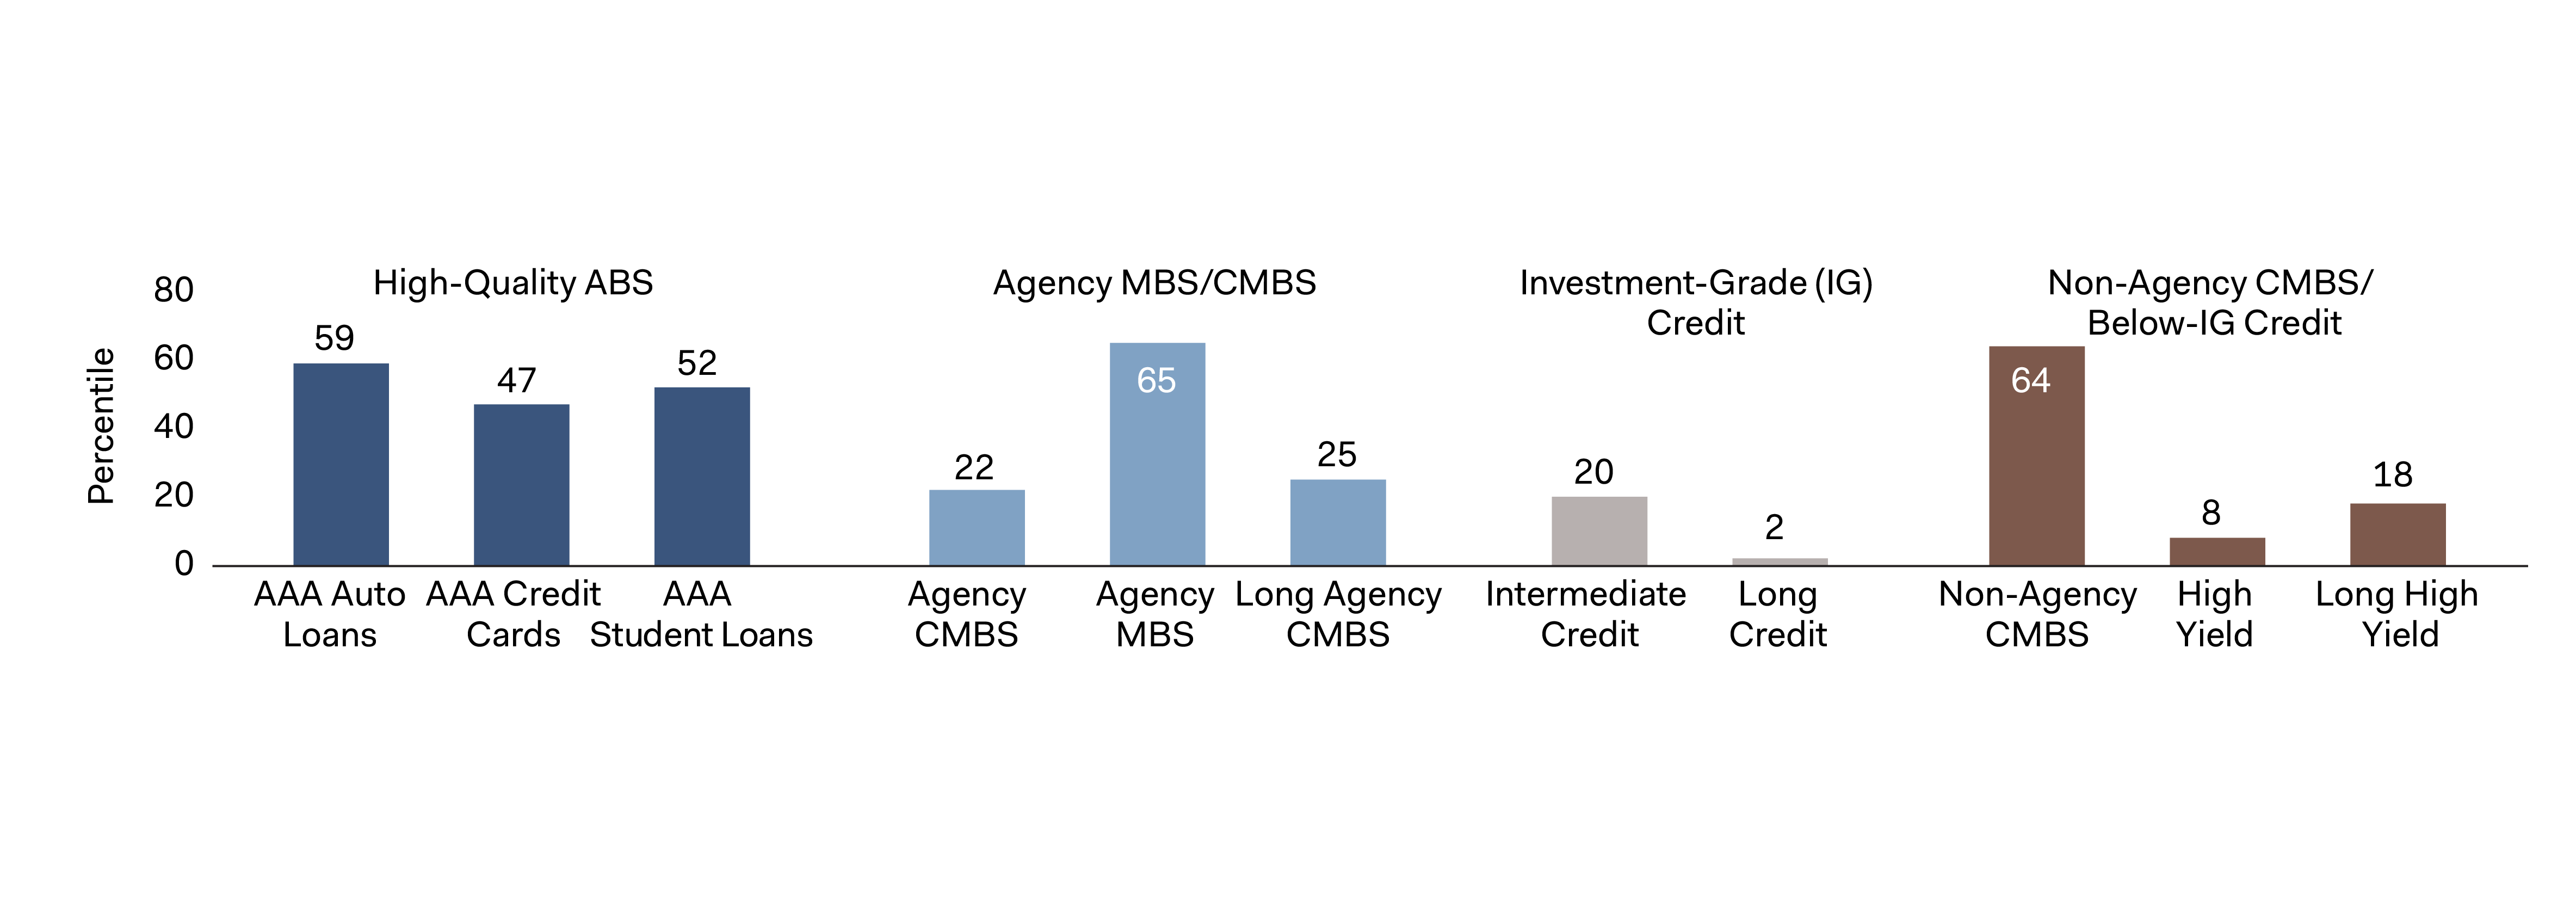
Source: Bloomberg Index Services, Dodge & Cox. Percentile reflects weekly observations over the 20-year period ended March 31, 2024.
If credit spreads remain range-bound for some time, a yield advantage coupled with individual issuer and issue selection may help generate alpha. However, should spreads widen, whether broadly or in a specific sector, as they did during the regional banking crisis a year ago, issuer selection and the ability to deploy assets back into credit quickly will be critical as well. We encourage plan sponsors to be prepared for both environments.
Refining the Liabilities and Their Hedges
For plan sponsors who have increased the precision of their liability-hedging (LH) strategies over the last few years, now may be a good time to further refine them. By working with their actuary and accountant, they can make efforts to ensure liability interest rate and credit spread sensitivities driving the LH strategy reflect:
- Cash balance (CB) benefits and other interest-rate-sensitive plan provisions (if applicable), and
- Most recent and plan-specific demographic assumptions.
Revisiting these methodologies and assumptions, and adjusting the LH strategy accordingly, can help reduce plan experience risk and year-to-year actuarial gains and losses on the balance sheet. This may be relevant for plans that have recently executed lump-sum windows and retiree lift-outs.
For example, following a retiree lift-out, vested deferred CB benefits are likely to comprise a larger portion of the liability, potentially justifying a closer analysis. CB benefits with bondbased interest crediting rates typically have very low duration (see sidebar). Ignoring this fact could lead to an overestimate of liability duration and overhedging. We plan to discuss nuances of CB hedging in an upcoming paper.
As for demographics, since retiree lift-outs often cover lowbenefit and typically higher-mortality retirees, the remaining liability is likely to consist of healthier participants.6 This means that liabilities developed using standard mortality tables may underestimate actual liability duration and lead to underhedging. This may also be true after a lump-sum window, especially for plans offering ongoing lump sums as subsequent lump-sum take-up rates may be lower. In addition to better liability matching, plan-specific demographic assumptions can help plan sponsors evaluate pension risk transfer (PRT) pricing. According to Aon, 95% of insurers in the PRT use zip codes as a proxy for longevity in developing their mortality assumptions.7

Pension Risk Transfer: Evolving Dynamics
According to LIMRA, 2023 set a record for the number of PRT transactions and posted the second-highest aggregate premium at $46 billion (compared to $52 billion in 2022). The first quarter of 2024 was also off to a robust start with a pair of jumbo retiree lift-outs totaling nearly $11 billion: $4.9 billion for Shell and $5.9 billion for Verizon. While the jumbo deals grab the headlines, the vast majority of PRT transactions remain well below $100 million, especially when it comes to plan terminations.7
Unlike their smaller brethren, large plan sponsors often face greater challenges when considering plan termination, including plan complexity, data quality, and settlement accounting. Two recent developments may create further hurdles:
- Regulatory uncertainty: SECURE 2.0 directed the Department of Labor (DOL) to review its guidance for selecting the “safest annuity available,” provide a report to Congress, and recommend any updates by year-end 2023. Although the DOL held stakeholder consultations and received recommendations from the ERISA Advisory Council to review this guidance, known as IB 95-1, it has not yet issued its report. Consequently, some plan sponsors may be wary of undertaking a PRT until the new guidance is issued, especially as some of the issues the DOL is considering were raised in recent litigation mentioned below.
- Legal risk: Former employees of Alcoa, AT&T, and Lockheed Martin filed class action lawsuits against their respective plan sponsors alleging that they acted imprudently by selecting Athene as their PRT insurer. In the case of AT&T, State Street Global Advisors (the independent fiduciary responsible for selecting the insurer) was also sued. At a high level, the lawsuits allege that Athene does not qualify as a “safest annuity available” under DOL 95-1 due to the nature of Athene’s private-equity ownership structure, investment strategy, offshore reinsurance arrangements, and regulatory jurisdiction. While these lawsuits are far from settled, the issues they illuminate have been raised in DOL consultations. The elevated headline risk may give some plan sponsors pause, while others may elect to consider only “traditional” insurers, which may lead to higher, and potentially unattractive, PRT pricing.
We look forward to seeing whether these considerations and evolving views on the pension surplus lead to changes in large plan sponsor approaches to PRT.
As always, we would welcome the opportunity to speak with you or your advisor about our pension risk management solutions as you progress along your pension journey.
Contributors


Disclosures
The above information is not a complete analysis of every material fact concerning any market, industry, or investment. Data has been obtained from sources considered reliable, but Dodge & Cox makes no representations as to the completeness or accuracy of such information. Opinions expressed are subject to change without notice. Information regarding yield, quality, maturity, and/ or duration does not pertain to accounts managed by Dodge & Cox. The above returns represent past performance and do not guarantee future results. Dodge & Cox does not seek to replicate the returns of any index. The actual returns of a Dodge & Cox managed portfolio may differ materially from the returns shown above. This is not a recommendation to buy, sell, or hold any security and is not indicative of Dodge & Cox’s current or future trading activity. The securities identified are subject to change without notice and may not represent an account’s entire holdings.
Source: Bloomberg Index Services Limited. BLOOMBERG® is a trademark and service mark of Bloomberg Finance, L.P. and its affiliates (collectively “Bloomberg”). Bloomberg or Bloomberg’s licensors own all proprietary rights in the Bloomberg Indices. Bloomberg does not approve or endorse this material, guarantee the accuracy or completeness of any information herein, or make any warranty, express or implied, as to the results to be obtained therefrom and, to the maximum extent allowed by law, shall have no liability or responsibility for injury or damages arising in connection therewith. The Bloomberg U.S. Long Credit Index measures the performance of investment grade, U.S. dollar-denominated, fixed-rate, taxable corporate and government-related debt with at least ten years to maturity. It is composed of a corporate and a non-corporate component that includes non-U.S. agencies, sovereigns, supranationals, and local authorities.
The MSCI ACWI (All Country World Index) Index is a broad-based, unmanaged equity market index aggregated from 50 developed and emerging market country indices. MSCI makes no express or implied warranties or representations and shall have no liability whatsoever with respect to any MSCI data contained herein. The MSCI data may not be further redistributed or used as a basis for other indices or any securities or financial products. This publication is not approved, reviewed, or produced by MSCI.
Endnotes
1. The information in this paper should not be considered fiduciary investment advice under the Employee Retirement Income Security Act. This paper provides general information not individualized to the particular needs of any plan and should not be relied on as a primary basis for investment decisions. The fiduciaries of a plan should consult with their advisers as needed before making investment decisions.
2. Option-adjusted spread (OAS) is the option-adjusted yield differential between stated index and comparable U.S. Treasuries. OAS does not translate into a return.
3. One basis point is equal to 1/100th of 1%.
4. Duration-adjusted, excess-of-curve return is the return of the index excess of the return of comparable-duration Treasuries over the time period, divided by the ending duration of the index.
5. Indices used in the analysis: AAA Auto Loans: Bloomberg ABS Auto AAA Index; AAA Credit Cards: Bloomberg ABS Credit Card AAA Index; AAA Student Loans: Bloomberg U.S. ABS Floating Rate Student Loan Aaa-rated Index; Agency CMBS: Bloomberg U.S. Agency CMBS Agg Eligible Index; Agency MBS: Bloomberg U.S. MBS Agency Fixed Rate MBS Index; Long Agency CMBS: Bloomberg U.S. Agency CMBS 8.5+ Year Index; Intermediate Credit: Bloomberg U.S. Intermediate Credit Index; Long Credit: Bloomberg U.S. Long Credit Index; Non-Agency CMBS: Bloomberg Non-Agency CMBS Agg Eligible Index; High Yield: Bloomberg U.S. High Yield Index; Long High Yield: Bloomberg Long U.S. High Yield Index.
6. Aon. “Longevity, Socioeconomics, and Pension Risk Transfers.” 2024. https://insights-north-america.aon.com/pension-risk-management/longevitysocioeconomics- and-pension-risk-transfers-whitepaper. This analysis suggests that liability present values can vary by several percentage points depending on the benefit amount.
7. Aon. “U.S. Pension Risk Transfer: 2023 Reflections and Looking Ahead.” March 2024. https://si-interactive.s3.amazonaws.com/prod/plansponsor-com/wp-content/uploads/2024/03/22180635/2024-PRT-Annual-Report_STAMPED.pdf